
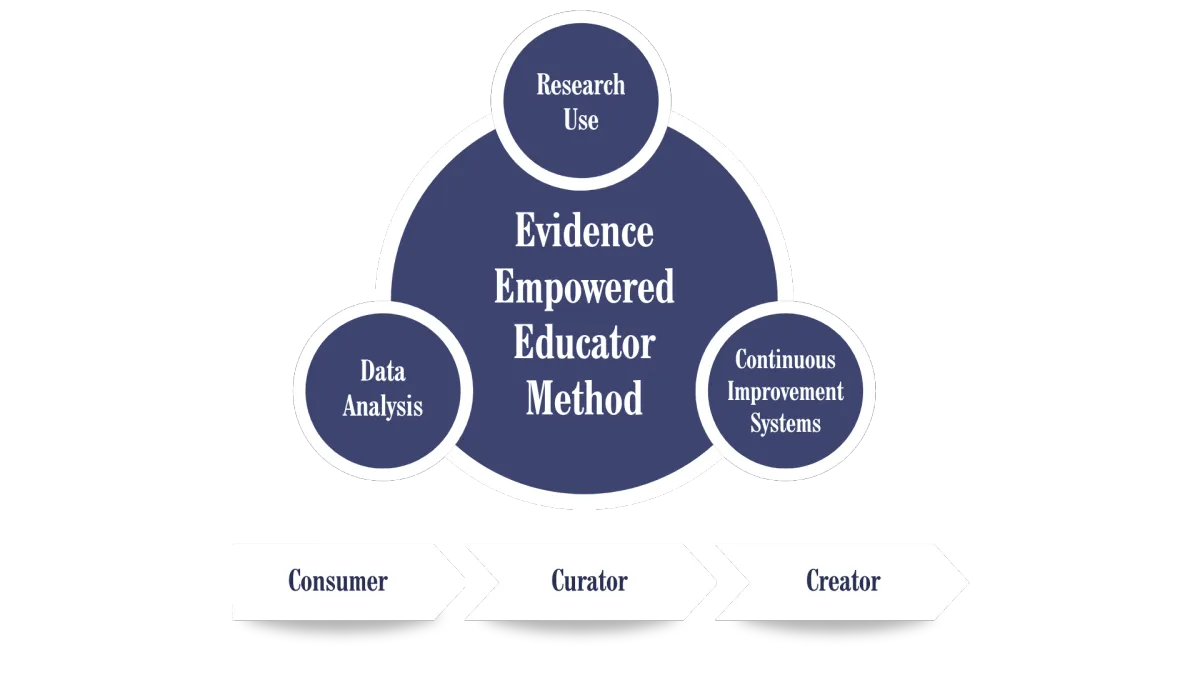
The Evidence Empowered Educator Method
Data Analysis
Seeing what's really happening, not just what's easy to report.
What Is Data Analysis?
Within the E3 Method, data analysis is not defined by how much data you have or how often you review it. It is defined by how effectively you are able to interpret that data in order to understand what is really happening.
Data analysis is the process of moving from numbers to meaning. It involves identifying patterns, examining variation, asking questions, and developing a deeper understanding of the system you are working within. It requires going beyond surface-level summaries and engaging with the data in a way that reveals underlying dynamics.
This is where many teams get stuck. They look at data, but they do not analyze it. They report results, but they do not interpret them. They identify trends, but they do not investigate what might be driving those trends. In these situations, data becomes something that is observed rather than something that is understood.
In the E3 framework, data analysis is not about producing reports. It is about generating insight that can inform better decisions.
Why Data Analysis Matters
When data is not analyzed effectively, it creates a false sense of clarity. Numbers can feel precise and objective, which gives the impression that they are telling a complete story. In reality, they are often only telling a small part of it.
Averages can suggest stability when there is significant variation beneath the surface. Trends can suggest progress when different groups of students are moving in different directions. Comparisons can highlight differences without explaining why those differences exist. When decisions are based on these incomplete interpretations, they may be well-intentioned but misaligned with the actual problem.
Strong data analysis helps teams avoid these traps. It allows educators to see beyond the surface and engage with the complexity of what is happening in their classrooms and schools. It creates the conditions for better questions, more precise decisions, and more effective responses.
In a field where time and resources are limited, that level of clarity is not optional. It is essential.
The Illusion of Understanding
One of the most common challenges in schools is what might be called the illusion of understanding. Teams look at data, recognize familiar patterns, and feel confident that they understand what is happening. This confidence is often based on quick interpretations of summary metrics such as averages or proficiency rates.
The problem is that these interpretations are rarely tested. They are accepted at face value. Over time, this creates a situation where decisions are made based on assumptions that feel true but may not actually reflect the underlying reality.
For example, a school might observe that overall scores have increased and conclude that current strategies are effective. Without deeper analysis, that conclusion may go unchallenged. However, a closer look might reveal that the increase is driven by a small group of students, while others are stagnating or declining. In that case, the initial interpretation, while not entirely incorrect, is incomplete in a way that matters for decision-making.
Data does not automatically produce understanding. It has to be examined, questioned, and interpreted with care.
Moving Beyond Averages
Averages are one of the most commonly used tools in data analysis, and they are also one of the most limiting when used in isolation. They provide a quick summary of performance, which makes them appealing. They are easy to calculate, easy to communicate, and easy to compare.
But they also hide important information.
Two groups can have the same average and look identical at a glance, while having completely different distributions of performance. One group may be tightly clustered around the mean, indicating consistency. The other may have a wide spread, with some individuals performing very high and others very low. From an improvement perspective, those are fundamentally different situations that require different responses.
Strong data analysis requires looking beyond the average and asking what is happening within the data. It involves examining how results are distributed, identifying patterns across subgroups, and understanding how performance changes over time. It requires a shift from summarizing data to exploring it.
This is where meaningful insight begins to emerge.
Understanding Variation
At the core of effective data analysis is an understanding of variation. Variation is often treated as noise, something to be smoothed out or ignored in favor of cleaner summaries. In reality, variation is one of the most important sources of information available.
It tells you where differences exist, how consistent results are, and whether changes over time are meaningful or simply part of normal fluctuation. It helps you distinguish between signals that require action and patterns that may not.
Without an understanding of variation, it is easy to misinterpret data. Small changes may be overemphasized, leading to unnecessary shifts in strategy. At the same time, meaningful trends may be overlooked because they do not appear dramatic in the short term.
Recognizing variation requires a more disciplined approach to analysis. It involves looking at data across time, across groups, and across contexts. It requires patience and a willingness to question initial impressions.
But when done well, it provides a much clearer picture of what is actually happening.
From Reporting to Inquiry
In many schools, data is used primarily for reporting. Teams gather data, organize it into charts or dashboards, and review it during meetings. The focus is on what happened. The conversation often ends there.
The E3 Method introduces a different approach. Instead of treating data as something to report, it treats data as something to inquire into.
This shift changes the nature of the conversation. Rather than stopping at trends, teams begin to ask why those trends exist. They explore differences across groups, examine changes over time, and consider multiple explanations for what they are seeing. They look for inconsistencies and treat them as opportunities for deeper understanding.
This kind of inquiry does not require advanced statistical techniques. It requires structure, discipline, and a commitment to moving beyond the surface. Over time, this shift transforms how data is used. It becomes a tool for learning rather than a tool for compliance.
What Data Analysis Looks Like in Practice
In schools where data analysis is strong, you can see it in how teams engage with information. Data is not simply presented and reviewed. It is actively explored.
Teams take time to examine patterns from multiple angles. They look at data across different groups of students, across different points in time, and across different contexts. They ask questions about what might be driving the patterns they observe. They consider alternative explanations and test their assumptions against the data.
Importantly, data is not used to confirm what teams already believe. It is used to challenge those beliefs and refine understanding. This creates a culture where decisions are grounded in evidence rather than assumption.
As a result, interventions become more targeted, progress is monitored more effectively, and improvement efforts are more likely to produce meaningful results.
Common Misconceptions About Data Analysis
There are several misconceptions that can prevent teams from developing strong data analysis practices. One of the most common is the belief that meaningful analysis requires advanced statistical expertise. While certain forms of analysis do require specialized knowledge, most of the insights that drive school improvement come from relatively straightforward approaches applied with consistency and care.
Another misconception is that having more data leads to better decisions. In reality, more data can create more confusion if there is no clear process for analyzing it. Without structure, teams may focus on the most visible metrics rather than the most informative ones.
There is also a tendency to equate dashboards with analysis. Dashboards are useful for organizing and displaying data, but they do not analyze it. They present information. The work of making sense of that information still needs to happen through interpretation and questioning. Addressing these misconceptions is an important step toward building stronger data analysis practices.
The E3 Shift: From Data to Insight
At the heart of the E3 Method is a shift in how data is understood and used. Instead of focusing on the collection and reporting of data, E3 emphasizes the generation of insight.
This shift changes the role of data in the improvement process. Data is no longer something that is reviewed periodically. It becomes an integral part of ongoing inquiry. It informs how problems are defined, how strategies are selected, and how progress is monitored.
It also creates a continuous feedback loop. As strategies are implemented, data is collected. That data is analyzed to determine what is working and what is not. The findings are then used to refine the approach. In this way, data analysis becomes part of a cycle of learning and improvement rather than a one-time activity.
Data Analysis and the Three Roles
Within the E3 framework, data analysis is expressed through the three roles of consumer, curator, and creator. As a consumer, the focus is on interpreting existing data in order to understand what is happening and inform decisions. As a curator, the focus shifts to organizing and communicating data so that others can engage with it effectively. As a creator, the role expands to include designing data collection processes and generating new data to answer specific questions.
These roles are not fixed positions. Educators move between them as they engage with data in different ways. Strong data analysis practices involve this movement, allowing individuals and teams to interpret, share, and generate insights as part of a connected system.
Building a Stronger Data Analysis Process
Improving data analysis does not begin with new tools. It begins with a better process. It starts with asking clearer questions that guide the analysis. It involves looking at data across multiple dimensions rather than relying on a single metric. It requires attention to variation, not just averages. It includes creating space for interpretation and discussion rather than rushing to conclusions.
Most importantly, it requires a shift in mindset. Data is not something to be reviewed and filed away. It is something to be explored, questioned, and used to deepen understanding. Over time, these shifts lead to more accurate interpretations, more effective decisions, and more sustainable improvement.
Putting Data Analysis Into Action
Understanding data is one thing. Using it effectively is another. Many schools have access to high-quality data but lack a system for using it consistently to drive improvement.
The E3 Method provides that system by connecting data analysis with research use and continuous improvement. It ensures that insights generated from data are used to inform decisions, and that those decisions are tested and refined over time.
For educators who want to strengthen their use of data, the next step is to engage with this work in a structured and collaborative way.
Inside the community, educators work together to analyze real data, ask better questions, interpret findings collaboratively, and apply those insights to real problems in their schools.
Final Thought
Data has the potential to transform how schools operate. But only if it is used well. The goal is not to collect more data. It is to understand the data you already have. When data analysis is done effectively, it reveals what is actually happening. It sharpens decision-making. It strengthens improvement efforts. And over time, it helps build a system where insight—not assumption—drives action.